[ad_1]
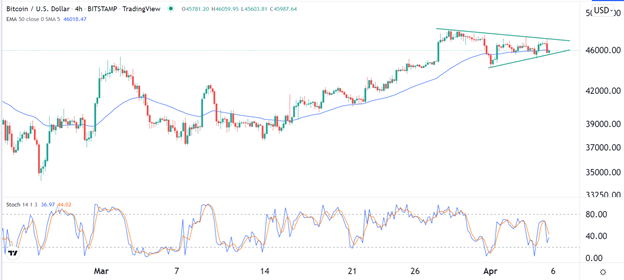
Since the triangle pattern is nearing its confluence zone, there is a likelihood that it will have a breakout soon.
Bullish View
- Buy the BTC/USD pair and a take-profit at 48,000.
- Add a stop-loss at 43,000.
- Timeline: 1-2 days.
Bearish View
- Set a sell-stop at 44,000 and a take-profit at 42,000.
- Add a stop-loss at 46,000.
The BTC/USD pair remained in a tight range in the past few days as the recent rally took a breather. The pair is trading at 45,920, which is about 4.8% below the highest point last week. It is substantially higher than its lowest point this year.
Bitcoin Activity Rising
The Bitcoin price has been in a narrow range even as supply concerns remain. Data compiled by Glassnode shows that the number of Bitcoins that have been mined have passed the 19 million mark. This means that only about 2 million coins are yet to be mined, meaning that the difficulty of mining will keep rising in the coming years.
At the same time, many large investors are buying Bitcoin as a form of financial collateral. The most recent big buyer was the Luna Foundation Guard, which announced that it would acquire Bitcoin worth $10 billion. The goal of its purchase is to use the coins as the backstop for the UST algorithmic stablecoin.
In the same period, MicroStrategy announced that it was spending over $200 million to increase its Bitcoin holdings. At the current price, the value of all Bitcoins it owns is higher than the total market cap of the firm. Most importantly, the total market cap of wrapped Bitcoin has been rising in the past few months.
Still, in aggregate, most exchanges are seeing net outflows, with Bitcoin balances in most exchanges falling to multi-year lows. But, according to Glassnode, many whales have continued to accumulate the coin.
The BTC/USD pair has also wavered as investors react to the ongoing risks of high-interest rates and quantitative tightening. In a statement on Tuesday, Lael Brainard became the first official to warn that the bank will start quantitative tightening soon.
BTC/USD Forecast
The 4H chart reveals that the pair has been in consolidation mode recently. It is trading at 45,920, where it has been in the past few days. The pair has also formed a symmetrical triangle pattern that is shown in green. The Average True Range (ATR) has dropped, signaling that volatility has faded.
Therefore, since the triangle pattern is nearing its confluence zone, there is a likelihood that it will have a breakout soon. While the direction of this breakout is unknown, there is a possibility that it will be in the upper side.

[ad_2]
