[ad_1]
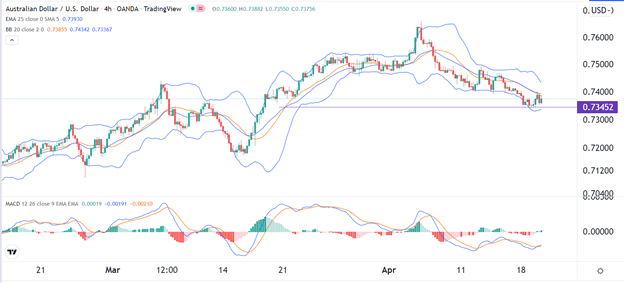
More downside will be confirmed if the price moves below the support at 0.7345.
Bearish View
- Set a sell-stop at 0.7345 and a take-profit at 0.7275.
- Add a stop-loss at 0.7450.
- Timeline: 1-2 days.
Bullish View
- Set a buy-stop at 0.7400 and a take-profit at 0.7500.
- Add a stop-loss at 0.7300.
The AUD/USD brushed off the latest minutes by the Reserve Bank of Australia (RBA) and the global economic downgrade by the IMF. The pair is still hanging near its lowest point since March 17th. It has fallen by more than 3.50% from its highest level this month.
RBA Minutes and Economic Slowdown
The RBA published the minutes of this month’s meeting on Tuesday. These minutes had no implication on the AUD/USD because they were in line with what analysts were expecting. The members agreed that inflation had picked up and that more upside was possible. They expect that the rate will be above 3% in the second quarter.
The members also believe that the economy was resilient and that consumer spending was rising after the government ended its travel restrictions. Most importantly, the committee said that the recent developments had caused it to bring forward the timing of its first rate hike. Analysts now expect that the first 0.25% rate hike will happen in June.
The AUD/USD weakness coincided with the overall strong US dollar. The dollar index crossed the $101 resistance level for the first time in years. It has been in a strong bullish trend as investors price in more and higher rate hikes by the Federal Reserve.
On Tuesday, US bond yields continued rising, with the 30-year crossing the 3.0% resistance level for the first time in years. Another notable thing was US real yields are close to moving to a positive level for the first time since March 2020. US inflation-adjusted bond yields rose to -0.04%, a sign tht bond payouts are about to exceed the medium-term inflation expectations.
The only data to watch on Wednesday will be the US existing home sales numbers. Economists expect these numbers to show that existing home sales dropped from 6.02 million in February to 5.80 million in March.
AUD/USD Forecast
On the 4H chart, the AUD/USD pair has formed a head and shoulders pattern. In price action analysis, this pattern is usually a bearish sign. The pair has also dropped below the 25-period and 50-period moving averages. It has also moved between the lower and middle lines of the Bollinger Bands while oscillators have been falling.
Therefore, more downside will be confirmed if the price moves below the support at 0.7345. If this happens, it will signal that there are still more sellers in the market. A move above the resistance at 0.7400 will invalidate this view.

[ad_2]
