[ad_1]
There is a possibility that the pair will continue falling ahead of the upcoming US consumer inflation data.
Bearish View
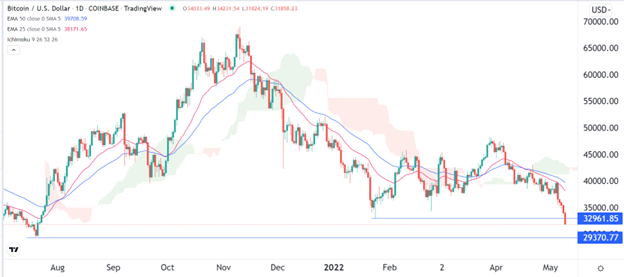
- Sell the BTC/USD pair and set a take-profit at 29,370.
- Add a stop-loss at 42,000.
- Timeline: 2 days.
Bullish View
- Set a buy-stop at 32,961 and a take-profit at 34,000.
- Add a stop-loss at 29,370.
The BTC/USD declined to the lowest level since July 23rd this year, which was about 52% from its highest level last year. Other cryptocurrencies and stocks have also sold-off dramatically, with the total market cap of all digital coins falling to about $1.5 trillion.
Cryptocurrency Currencies Sell-Off
Bitcoin price has been in a strong sell-off recently as worries about the Federal Reserve, US inflation, and recession continued. Other financial assets have also sold-off. For example, the tech-heavy Nasdaq 100 index has declined by 26% from its highest point in November. Similarly, the Dow Jones index has fallen by 12% in the same period.
Even the so-called safe assets have all declined. Gold has plummeted by 10% from its highest point in February while Treasuries have also fallen. The 10-year and 30-year Treasury Yields have risen to the highest levels in over 3 years. Bond yields are usually inverse to prices.
The sell-off accelerated when the Federal Reserve published a hawkish decision last week. In a statement, the bank said that it was hiking interest rates by 0.50%. At the same time, it warned that more 50 basis point hikes were on the way as it continues battling the soaring consumer price index data.
The BTC/USD pair has also declined because of the increased selling by many holders who are giving up on hopes that it will retest its all-time high. Besides, the unlimited liquidity that existed in 2021 has faded. For one, the US and other European countries are no longer providing the stimulus checks that they gave out last year.
All these factors have pushed investors to the safety of the US dolla. Indeed, the dollar index has been in a strong uptrend and is currently trading at the highest point since 2002.
BTC/USD Forecast
The daily chart shows that the BTC/USD pair has been in a strong downward trend in the past few months. The sell-off accelerated when the pair moved below the important support level at $32,961, which was the lowest level on January 24th. The pair has moved below the Ichimoku cloud and the 25-day and 50-day moving averages.
Therefore, there is a possibility that the pair will continue falling ahead of the upcoming US consumer inflation data. As a result, the next reference level to watch will be at 29,370.

[ad_2]
