[ad_1]
There is a likelihood that it will soon have a bearish breakout.
Bearish View
- Sell the BTC/USD pair and set a take-profit at 28,000.
- Add a stop-loss at 31,000.
- Timeline: 1-2 days.
Bullish View
- Set a buy-stop at 31,000 and a take-profit at 32,500.
- Add a stop-loss at 28,000.
The BTC/USD price is still going horizontal after it was criticized by one of the most influential people in finance. Bitcoin is trading at 30,000, where it has been stuck in for almost three weeks.
Scott Minerd Bearish on Bitcoin
Scott Minerd is one of the most respected people in the finance industry. He has been the Chief Investment Officer (CIO) of Guggenheim Partners, a company with over $325 billion in assets under management. It is also one of the best-performing firms in the US.
Speaking at a conference in Davos, Mined warned that the coin could drop to about $8,000. He noted that Bitcoin had not established itself as a credible institutional investment because of its volatility. He also noted that the company had bought Bitcoin at $20,000 and exited when it surged to $40,000. In previous statements, Minerd said that he believed that Bitcoin could rise to over $400,000 in the coming years.
In reality, most institutional investors have not invested in Bitcoin. They include giant companies like Blackrock, Vanguard, and T.Rowe Price among others. Some of the big companies that have allocated cash to BTC are companies like MassMutual and Fidelity.
The BTC/USD pair moved sideways as data in the options market showed that the put to call ratio has started falling recently. The ratio has dropped to about 0.63, which is lower than this month’s high of almost 0.70. Ideally, a lower figure is often interpreted as being a bullish catalyst for Bitcoin prices.
Another notable thing is that Bitcoin’s correlation with American stocks has been a bit muted this week. While stocks have dropped sharply following weak earnings and forward guidance, Bitcoin has continued moving sideways.
BTC/USD Forecast
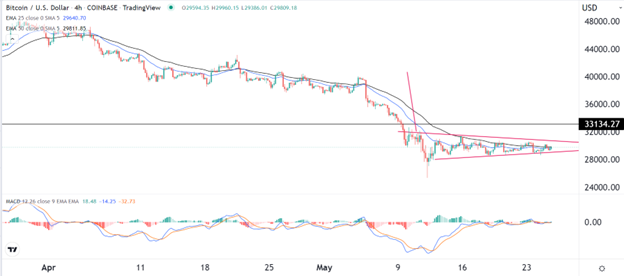
The BTC/USD pair has moved sideways in the past few days. On the four-hour chart, the coin has flattened along the 25-day and 50-day moving averages while the two lines of the MACD are along the neutral line.
Further, the pair has formed what looks like a bearish flag pattern, which is usually a bearish sign. Therefore, with this pennant nearing its confluence level, there is a likelihood that it will soon have a bearish breakout. If this happens, the next key support level to watch will be at 28,000. A move above the resistance level at 31,000 will invalidate the bearish view.

[ad_2]
