[ad_1]
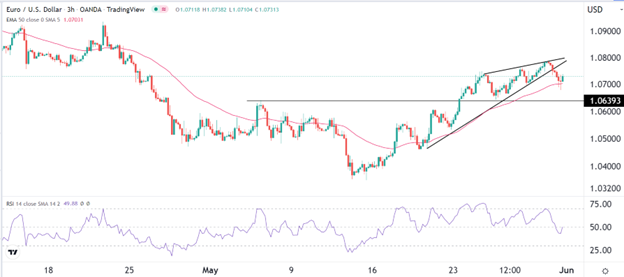
Because of the wedge pattern, the pair will likely retest the support at 1.0640.
Bearish View
- Sell the EUR/USD pair and set a take-profit at 1.0640.
- Add a stop-loss at 1.0775.
- Timeline: 1-2 days.
Bullish View
- Set a buy-stop at 1.0755 and a take-profit at 1.0800.
- Add a stop-loss at 1.0700.
The EUR/USD pair declined slightly as the outlook of the European economic outlook worsened. It dropped to a low of 1.0676, which was the lowest level since May 14th. It is still about 1% below the highest level in May.
EU Economic Outlook
The European Union’s economic outlook worsened on Tuesday after the bloc unveiled measures to gradually phase out Russian oil imports. The bloc’s countries will still receive Russian oil that flows using pipelines.
Perhaps, the most important restrictions were on oil shipping insurance since European companies have a strong market share in the industry. The bloc will ban its companies from insuring Russian cargo.
These announcements came on the same day that European countries published strong consumer inflation data. According to Eurostat, the bloc’s inflation surged to the highest level recorded. It blamed this trend to the soaring energy and food costs.
Therefore, the soaring inflation will put more pressure on the European Central Bank (ECB) as it considers rate hikes. Most economists expect the bank will hike interest rates by 0.25% in the July meeting and then exit negative rates in September.
The EUR/USD pair is also reacting to the relatively positive data from the United States. On Tuesday, data showed that home prices surged to a record level in March. The Case-Schiller house price index rose by 20% year-over-year in March. This signals that the housing market is still hot although signs of weakness have emerged.
Meanwhile, data by the Conference Board revealed that consumer confidence declined from 108.6 in April to 106.4 in May. This decline was better than the median estimate of 103.9. Focus now shifts to the upcoming jobs numbers that will come out in the next three days.
The US will release the JOLTs vacancies numbers on Wednesday followed by initial jobless claims and NFP on Thursday and Friday, respectively.
EUR/USD Forecast
The three-hour chart shows that the EUR/USD pair formed a rising wedge pattern that is shown in black. In price action analysis, this pattern is usually a bearish sign, which explains why it made a bearish breakout on Tuesday. The pair is still above the important support level at 1.0640, which was the highest point on May 5th.
The EUR/USD pair remains above the 50-period moving average. Therefore, because of the wedge pattern, the pair will likely retest the support at 1.0640.

[ad_2]
