[ad_1]
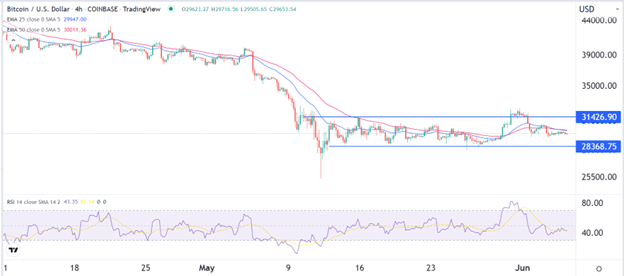
Since it has formed a small head and shoulders pattern, there is a likelihood that it will have a bearish breakout to about 28,368.
Bearish View
- Sell the BTC/USD pair and set a take-profit at 28,368.
- Add a stop-loss at 31,000.
- Timeline: 1 day.
Bullish View
- Set a buy-stop at 30,500 and a take-profit at 31,500.
- Add a stop-loss at 29,000.
The BTC/USD price is still in a consolidation phase as investors focus on the new developments in the industry. Bitcoin is trading at 29,650, where it has been in the past few days. This price is 8.42% below the highest level last week. Its market cap has dropped to about $565 billion.
Bitcoin is Still Ranging
Bitcoin has been in a consolidation phase as investors start preparing for a recession in the next few months. Some of the most important companies in the US like Walmart, Target, JP Morgan, and Tesla have all issued a warning about the state of the economy.
This is one of the top reasons why American stocks declined sharply last Friday. The blue-chip Dow Jones index declined by more than 340 points while the Nasdaq 100 and S&P 500 indices fell by more than 1.50%. In the past few months, Bitcoin has been having a close correlation with American stocks.
The BTC/USD pair is also consolidating as the volume of buyers has declined. On-chain data shows that inflows into Bitcoin have been a bit limited in the past few weeks. Investors are simply afraid of buying Bitcoin in a period when the Fed has already started implementing quantitative tightening. It started reducing its balance sheet last week by about $47 billion. It expects to double this amount to about $95 billion in the coming months.
In addition to QT, the Fed has started hiking interest rates. This month, the bank is expected to hike interest rates by 0.50%. It will then hike by 0.50% in the upcoming two meetings and then likely pause on more hikes.
The BTC/USD pair is also moving sideways as the put to call ratio remains in a tight range. The ratio is currently at 0.68, where it has been in the past few days.
BTC/USD Forecast
The four-hour chart shows that the BTC/USD pair is consolidating. The pair is trading at 29,667, which is lower than last week’s high of 32,290. It has moved below the important resistance level at 31,426, which was the highest point on May 16th. The pair has also dropped slightly below the 25-day and 50-day moving averages while the Relative Strength Index is slightly below the neutral point at 50.
Therefore, since it has formed a small head and shoulders pattern, there is a likelihood that it will have a bearish breakout to about 28,368.

[ad_2]
