[ad_1]
Bearish View
- Sell the AUD/USD and set a take-profit at 0.6650.
- Add a stop-loss at 0.6875.
- Timeline: 1-2 days.
Bullish View
- Set a buy-stop at 0.6812 and a take-profit at 0.6900.
- Add a stop-loss at 0.6750.
The AUD/USD bearish trend stalled at an important support after the hawkish FOMC minutes and the sliding commodity prices. It is trading at 0.6800, which is substantially lower than where it started the year at.
US Dollar and Commodities Divergence
The Reserve Bank of Australia concluded its meeting on Tuesday and delivered a 0.50% rate hike. As a result, the Aussie retreated since the hike was already priced in by market participants.
Notably, the bank said that it will likely continue hiking interest rates but cautioned that it will be data dependent. The RBA, like other major central banks, is attempting to bring inflation to its 2% target.
The AUD/USD retreated because of the hawkish minutes by the Federal Reserve. The minutes showed that members were still convinced that higher rates were needed to fight inflation. The members are still torn between a 0.75% and a 0.50% rate hike.
Still, there are some positive signs that inflation is about to start falling in the coming months. For example, the price of crude oil has tumbled from the YTD high of $135 to below $100. Similarly, the price of natural gas has also plummeted even as the crisis in Ukraine escalates.
Other commodities are moving to a bear market. Copper and iron ore have moved to the lowest point in more than a year. Therefore, there is a possibility that these prices will be passed to consumers.
The main catalyst for the AUD/USD will be the upcoming private sector payrolls by ADP. Analysts expect the data to show that the sector created 200k jobs in June even as the cost of doing business rose. These numbers will provide a preview of the official jobs numbers that are scheduled for Friday. The US will also publish the latest export and import data.
AUD/USD Forecast
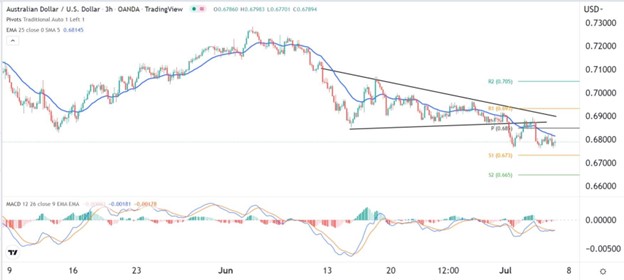
The three-hour chart shows that the AUD/USD pair formed a descending triangle pattern in June. It then moved below that pattern on Friday last week. In price action analysis, this pattern is usually a sign of a bearish continuation.
The pair then formed a break and retest pattern when it moved to the lower side of the triangle. It has moved below the 25-day moving averages while the MACD has moved below the neutral point. Therefore, the outlook is still bearish, with the next target to watch being at 0.6650, which is along the second support level.

[ad_2]
