[ad_1]
There is a likelihood that the pair will continue falling as sellers target this support level.
Bearish View
- Sell the GBP/USD pair and set a take-profit at 1.2000.
- Add a stop-loss at 1.2200.
- Timeline: 1-2 days.
Bullish View
- Set a buy-stop at 1.2150 and a take-profit at 1.2250.
- Add a stop-loss at 1.2050.
The GBP/USD price pulled back on Monday morning as investors prepared for a relatively busy week ahead for the British pound. It dropped to a low of 1.2100, which was the lowest level since August 10th of this year. This price was also sharply lower than this month’s high of 1.2291.
UK Inflation and Jobs Data
The GBP/USD pair came under intense pressure as investors waited for the upcoming economic data from the UK.
On Tuesday, the Office of National Statistics (ONS) will publish the latest jobs numbers from the country. Economists expect the data to show that the labor market continued tightening in June as the recovery continued.
Precisely, analysts expect that the unemployment rate remained unchanged at 3.8% in June this year. They also expect that the country’s employment change in the three months to June was 253k, lower than the previous 296k.
Additional data are expected to reveal that the average earnings excluding bonuses rose from 4.3% to 4.5%. With bonuses, analysts expect that the average earnings index rose by 4.5%.
The GBP/USD price will also react to the upcoming UK consumer and producer inflation data scheduled for Wednesday. Economists expect these numbers to reveal that the country’ consumer inflation continued surging in July as it hit 9.8%. Excluding the volatile food and energy products, analysts believe that inflation rose from 5.8% to 5.9%.
These numbers will come a few days after the Office of National Statistics (ONS) published relatively weak GDP numbers. The data showed that the country’s economy contracted in the second quarter as the cost of living escalated. It shrank by 0.1% quarter on quarter after it expanded by 0.8% in Q1. The economy shrank by 0.6% in June, which was better than the median estimate of 0.4%.
GBP/USD Forecast
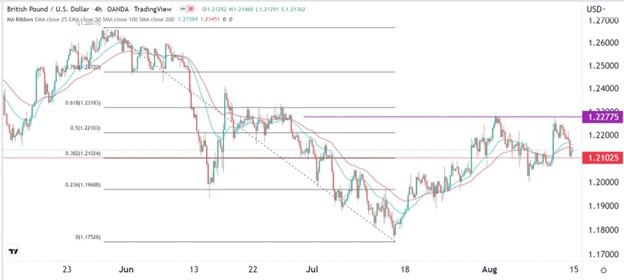
The four-hour chart shows that the GBP/USD pair dropped after the UK published the latest GDP data. It retested the 38.2% Fibonacci Retracement level and moved slightly below the 25-day and 50-day moving averages.
The pair has also found strong resistance at 1.2277, where it struggled to move above this month. As such, this could be a double-top pattern whose neckline is at 1.200.
Therefore, there is a likelihood that the pair will continue falling as sellers target this support level. A move above the resistance point at 1.2180 will invalidate the bearish view.

Ready to trade our daily Forex signals? Here’s a list of some of the best Forex trading platforms to check out.
[ad_2]