[ad_1]
Bitcoin is gently selling off on deteriorating risk sentiment.
Previous BTC/USD Signal
My previous signal on 8th August was not triggered as there was no bullish price action when the support levels which I had identified were first reached that day.
Today’s BTC/USD Signals
Risk 0.50% per trade.
Trades may only be entered before 5pm Tokyo time Friday.
Long Trade Ideas
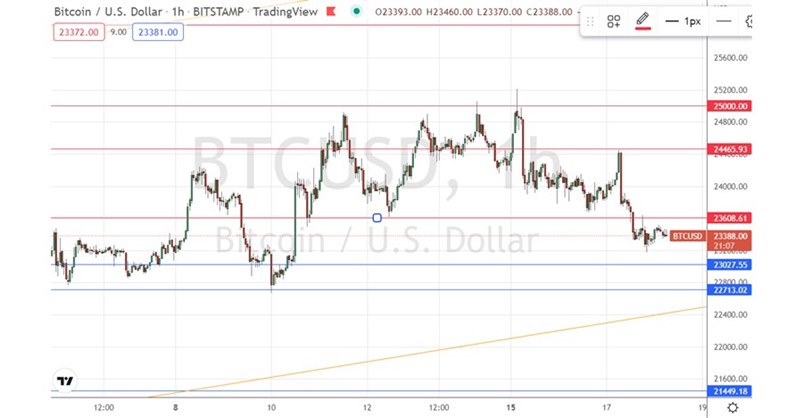
- Go long after a bullish price action reversal on the H1 timeframe following the next touch of $23,028 $22,713, or $21,449.
- Place the stop loss $100 below the local swing low.
- Adjust the stop loss to break even once the trade is $100 in profit by price.
- Take off 50% of the position as profit when the trade is $100 in profit by price and leave the remainder of the position to run.
Short Trade Ideas
- Go short after a bearish price action reversal on the H1 timeframe following the next touch of $23,609 or $24,466.
- Place the stop loss $100 above the local swing high.
- Adjust the stop loss to break even once the trade is $100 in profit by price.
- Take off 50% of the position as profit when the trade is $100 in profit by price and leave the remainder of the position to run.
The best method to identify a classic “price action reversal” is for an hourly candle to close, such as a pin bar, a doji, an outside or even just an engulfing candle with a higher close. You can exploit these levels or zones by watching the price action that occurs at the given levels.
BTC/USD Analysis
I wrote in my previous analysis on 8th August that the price of BTC/USD was continuing to rise gently and be held by a wide bullish price channel.
I thought that the support level I identified at $23,585 would likely be pivotal over the day.
These were good calls, as once the price broke below $23,585 it continued to fall by a considerable distance. Ten days later, the price is still trading within the same gently rising price channel but has sold off since reaching the big round number at $25k.
The selloff in Bitcoin is probably getting some tailwind from, the recovery by the US Dollar and the decline in risk sentiment following the release yesterday of FOMC meeting minutes.
The resistance level at $23,609 looks attractive for a short trade as its clearly become “stairstep” resistance so will probably be likely to hold if reached. I would want to see a rejection of the level from below and a clear bearish reversal before entering. I would be comfortable trading short today despite the rising price channel.
If the price reaches the support level at $22,713 that could be significant as it is close to the bottom of the price channel, so there is scope to hope for a medium to long-term bullish price movement beginning from a firm bullish bounce there.
https://www.tradingview.com/chart?symbol=COINBASE%3ABTCUSD

Concerning the US Dollar, there will be a release of the Philly Fed Manufacturing Index at 1:30pm London time.
Ready to trade our daily Forex signals? Here’s a list of some of the best crypto brokers to check out.
[ad_2]