[ad_1]
A move above the resistance point at 20,500 will invalidate the bearish view.
Bearish view
- Sell the BTC/USD pair and set a take-profit at 18,500.
- Add a stop-loss at 20,500.
- Timeline: 1-2 days.
Bullish view
- Set a buy-stop at 20,500 and a take-profit at 21,500.
- Add a stop-loss at 18,000.
The BTC/USD currency pair continued slumping on Monday morning as the recent sell-off continued. Bitcoin dropped to a low of $19,788, which was the lowest level since July 14 of this year. It has fallen by more than 20% from the highest point this month.
Hawkish Federal Reserve
Bitcoin, other cryptocurrencies, and stocks dropped sharply after Jerome Powell’s speech at the Jackson Hole Symposium in Wyoming.
In his speech, Powell warned that the Fed was still concerned about the significantly high inflation in the country. As a result, he said that the bank will continue hiking interest rates in the coming months. He also hinted that the Fed will likely leave interest rates at elevated levels in 2023.
His statement came a few days after Joe Biden announced that he will forgive student debt for millions of Americans. Some analysts believe that this debt forgiveness will cost over $1 trillion in a decade. It will also likely lead to some inflation in the coming months.
Powell’s statement mirrored that of other Fed officials like Mary Daly, Neel Kashkari, and Charles Evans. Therefore, there is a likelihood that the Fed will hike interest rates by 0.50% in the coming meeting in September.
Historically, Bitcoin and other risky assets tend to do well in a period when the Fed has embraced a more hawkish tone. The recent rebound was mostly because analysts were expecting the bank to start slowing its rate hikes and even start cutting in 2023.
Bitcoin’s crash coincided with a sharp decline in American equities. The Dow Jones crashed by over 1,000 points while the S&P 500 and the Nasdaq 100 indices dropped by over 3.3%. The futures market also signals that American shares will open sharply lower.
BTC/USD forecast
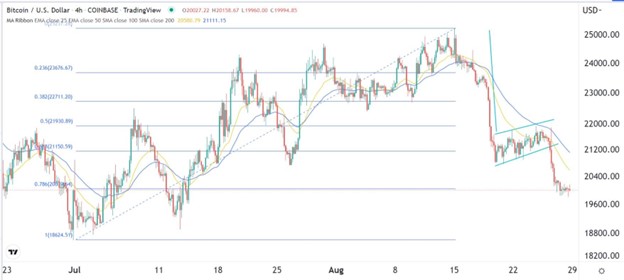
The four-hour chart shows that the BTC/USD price formed a triple-top pattern in July and August. It also formed a bearish flag pattern that is shown in green. In price action analysis, this pattern is usually a bearish sign. It also moved below the 78.6% Fibonacci Retracement level and the 25-day and 50-day moving averages.
Therefore, the pair will likely continue falling as sellers target the year-to-date low of 18,624 since it seems like they are in control. A move above the resistance point at 20,500 will invalidate the bearish view.

Ready to trade our free Forex signals? Here are the best MT4 crypto brokers to choose from.
[ad_2]
