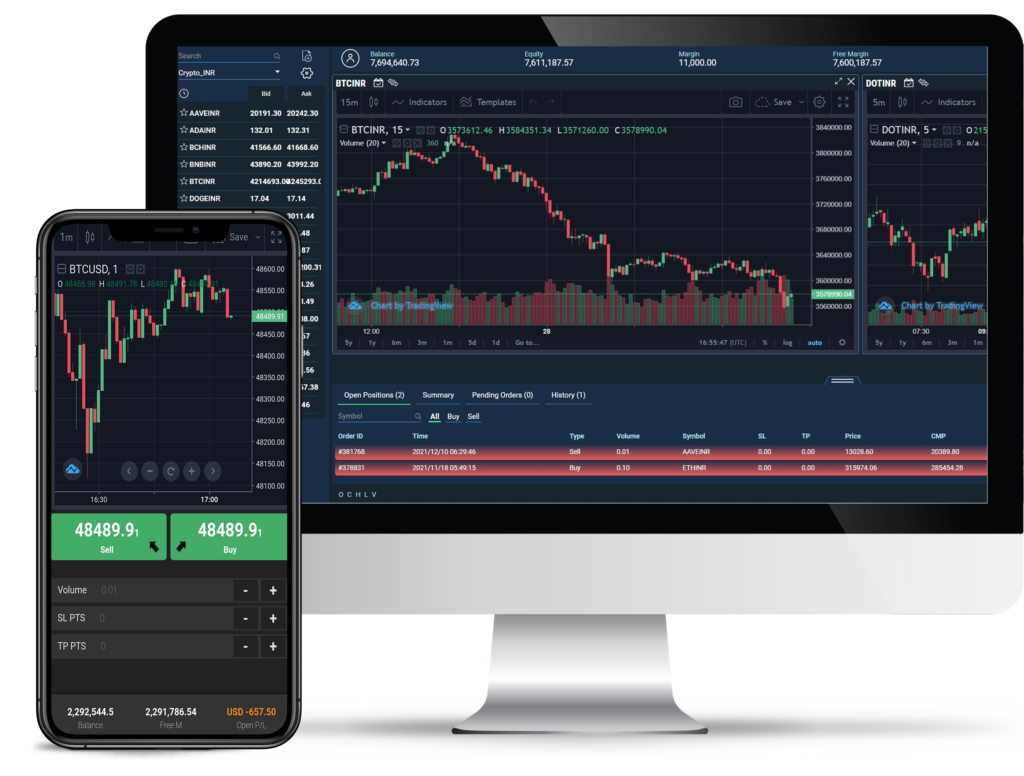
200+ Trading Pairs With An Innovative Trading Facility
Lightning fast execution. Low spreads.
An ideal tool kit for active day trading.
For BROWSER :
For WINDOWS:
For Android:
For IOS:

Monthly Trading Volume
Avg Execution Time
Countries Served

Global Stock Markets with no transaction costs
Invest from just $1, Trade from just $100
Hundreds of Stocks & Stock CFDs from various exchanges of the world, with no commissions!
More than 25,000 traders trust our platform
We are the most trusted broker for beginners and pros alike with our powerful trading platform
- Access to 250+ products
- Superfast execution speed
- Fast, easy-to-use web platform
- Multiple deposit & withdrawals
- Feature rich environment
- 24/5 customer support
500
Leverage
272
Trading Pairs
5
Spreads From

Trade and Invest in 250+
Trading Pairs Today
Trade global markets with xMeta to take advantage of both rising and falling prices.

Forex
Spreads as low as 0.0 pips
Trade EURUSD and USDJPY

Indices
Commission from 0 USD
Trade NASDAQ100, US30 & SPX500

Metals
Spreads as low as 0.8 pips
Trade Glod and Silver

Commodities
Commission from 0 USD
Trade Crude Oil and Natural Gas

Stocks
Commission from 5 USD
Trade Apple, Google and more

Cryptocurrencies
Spreads as low as 3.6 pips
Trade Bitcoin and Ethereum
