[ad_1]
We expect natural gas to rise during its upcoming trading.
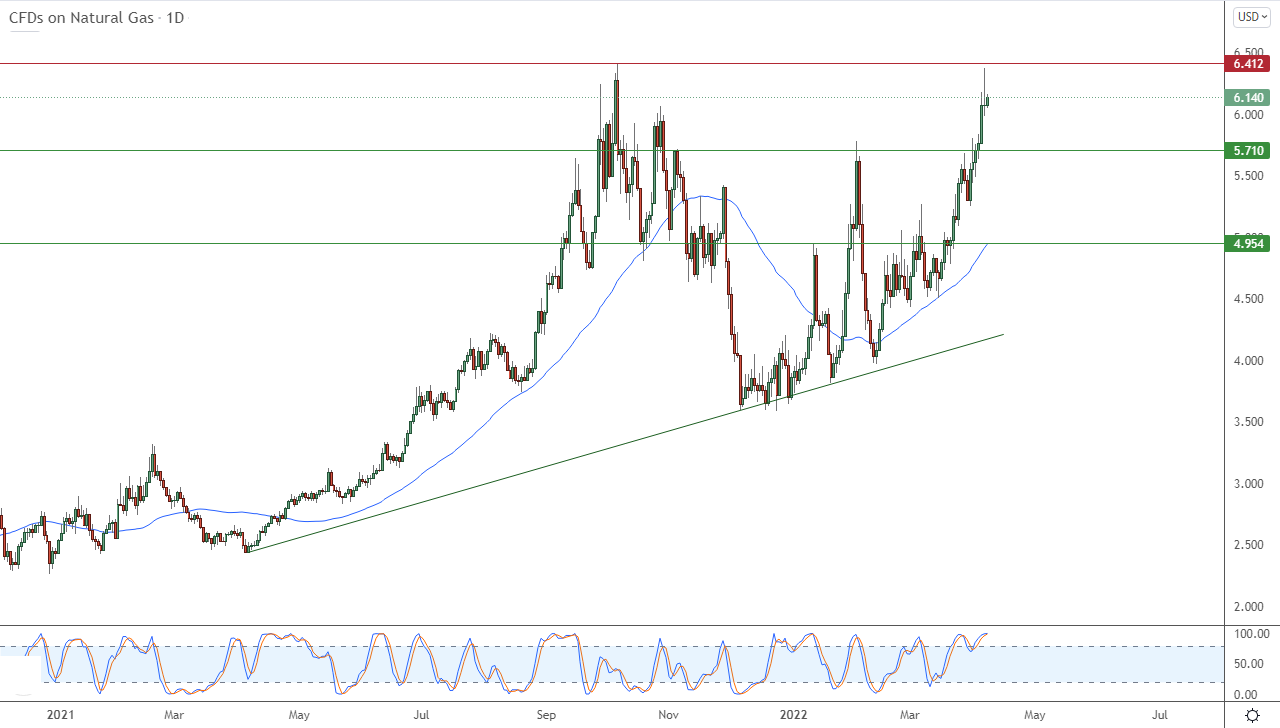
Spot natural gas prices (CFDS ON NATURAL GAS) continued to rise during the recent trading at intraday levels, to achieve new daily gains until the moment of writing this report. It rallied at a rate of 1.14%, to settle at its highest price since January at $6.143 per million British thermal units. After rising during yesterday’s trading in a volatile session, for the sixth consecutive day, it increased by 0.07%.
US natural gas prices were on course to stabilize on Wednesday at their highest levels since January, but gave up all their gains to close almost unchanged.
Prices traded as high as $6,394, which would have represented the highest finish since December of 2008. They are still trading up more than 5% for the week.
On Wednesday, the United States and its allies unveiled new sanctions against Russia over its invasion of Ukraine, including a ban on all new investments in the country, and the two daughters of Russian President Vladimir Putin were also targeted. However, the European Union has stopped joining the United States and the United Kingdom in banning Russian oil imports.
However, EU officials have indicated that there is likely to be more talk of phasing out Russian oil and natural gas. European Council President Charles Michel told the European Parliament on Wednesday that measures on “oil and even gas will also be required sooner or later”.
Although the gas market saw the first injection of stocks a week ago, the US government inventory report due later in the day is likely to reflect another pullback. Estimates ahead of Thursday’s Energy Information Administration (EIA) report are for a breakeven in the high range of 20 billion cubic feet.
Technically, the price continues to rise amid the dominance of the main bullish trend in the medium term along a slope line, with the continuation of the positive support for its trading above its simple moving average for the previous 50 days, to prepare the stock for its recent rise to attack the pivotal resistance level 6.412, as shown in the attached chart for a period of time.
However, despite these positive signs, we notice the start of a negative crossover on the RSIs, after they reached overbought areas, and we notice that a negative candlestick pattern was drawn yesterday, which suggests signs of weakness in the price’s continued rise.
Therefore, we expect natural gas to rise during its upcoming trading, to target the pivotal resistance level 6.412. But we do not expect the possibility of breaching that resistance, unless we witness a correction during which the price gathers its positive forces and disposes of some of its excess.

[ad_2]
