Start the week of April 25, 2022 with our Forex forecast focusing on major currency pairs here.
EUR/USD
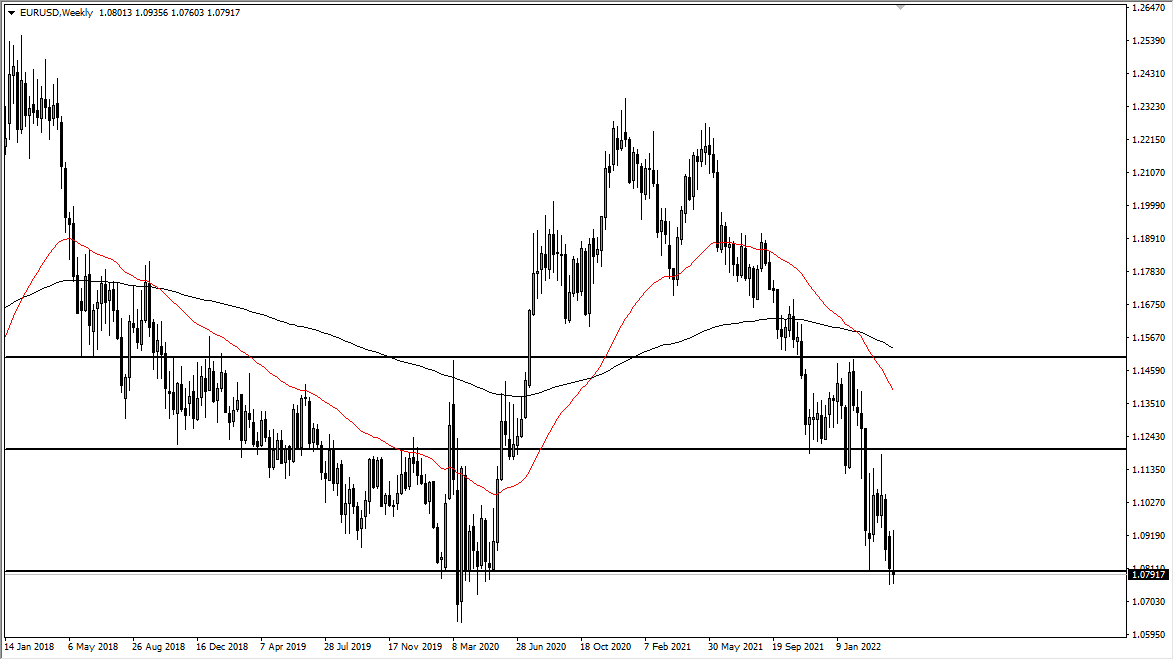
The euro initially tried to rally last week but found enough selling pressure to turn things around and form an inverted hammer that sits right on top of the 1.08 level. At this point, it looks like the euro is in significant trouble, so if we were to break down below the 1.08 level underneath, then we may grind down to the 1.06 handle. Rallies at this point are not to be trusted, at least not until we can break above the 1.12 level, something that we are nowhere near doing at the moment.

AUD/USD
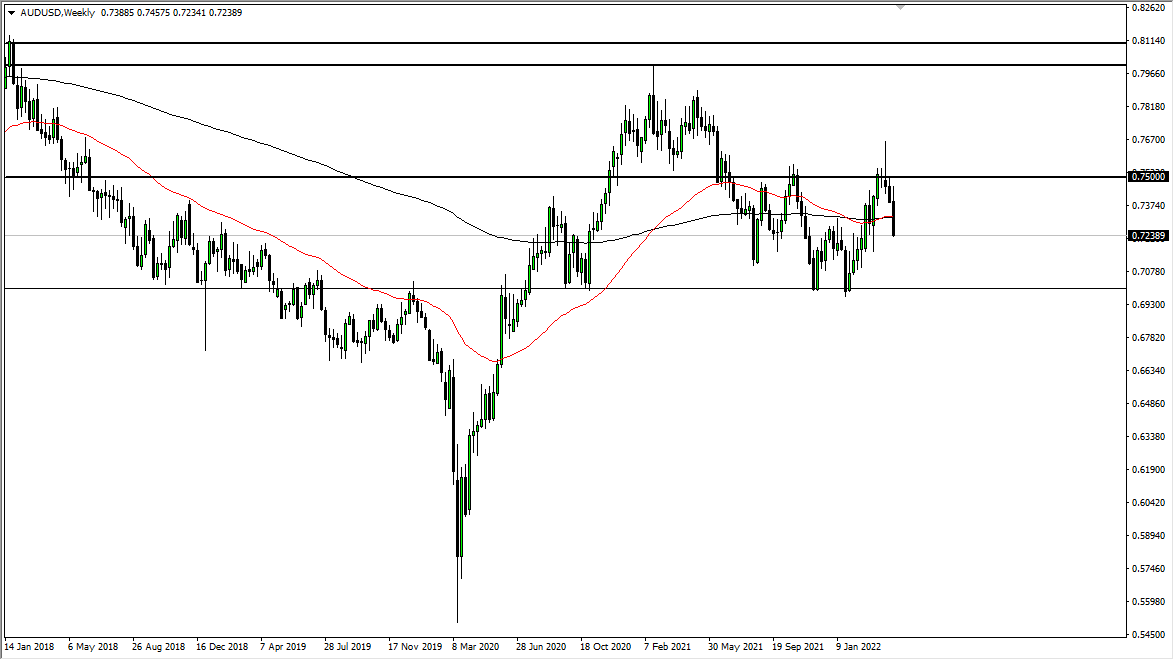
The Australian dollar initially tried to rally last week but then fell apart to break below the 0.73 level without too many issues. At this point, the market looks as if it is ready to go much lower, perhaps looking to get down to the 0.70 level. This is a simple continuation of the negativity that we had seen for some time, with the 0.75 level being a massive resistance barrier. The 0.70 level has been massive support previously, so I do think that there will be a bit of a fight down in that area. In the short term, I think that any time we rally, you should be looking for exhaustion to take advantage of selling opportunities.

GBP/JPY
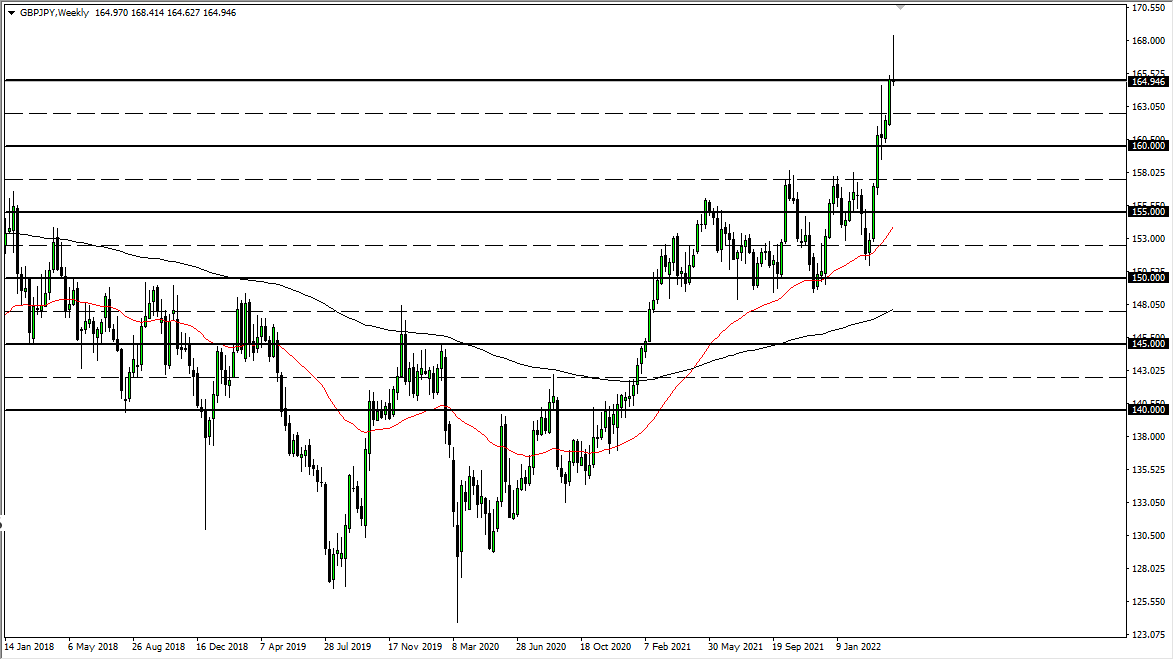
The British pound rallied significantly during the week but gave back 300 pips. By doing so, the market ended up forming a massive shooting star, and the fact that the British pound fell through major support against the US dollar suggests that this market is ready to roll over as well. A breakdown below the weekly candlestick more likely than not will open up the possibility of a move down to the ¥162.50 level. I have no interest in buying this pair anymore as it has gotten far ahead of itself.

NZD/JPY
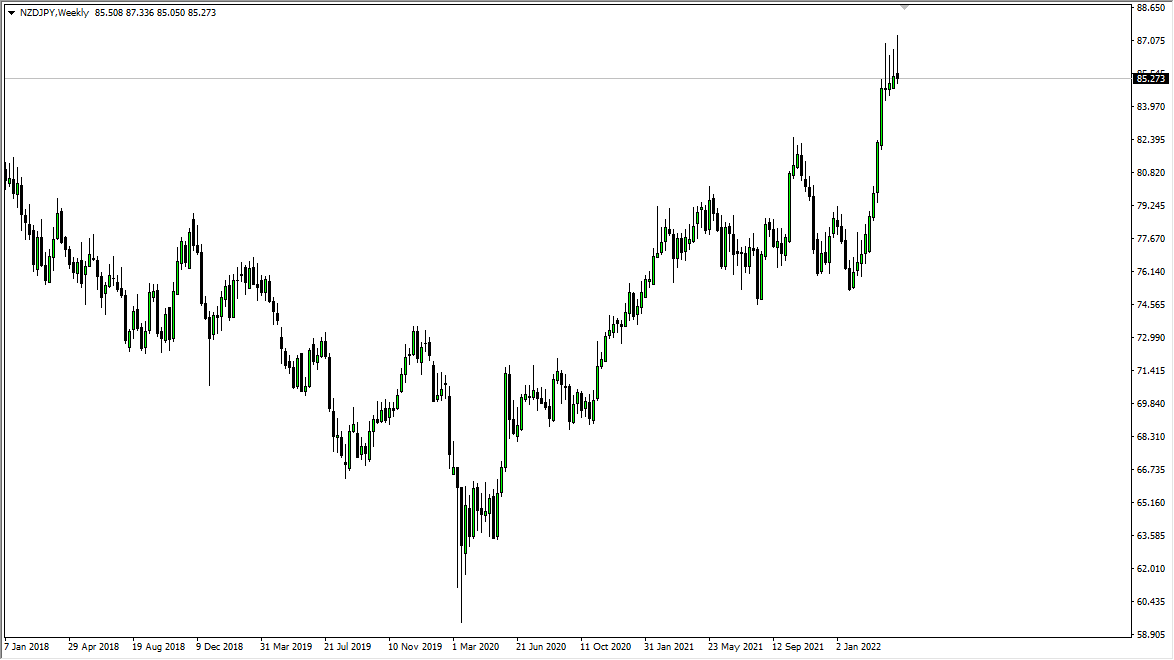
The New Zealand dollar formed the fourth shooting star in a row on the weekly chart against the Japanese yen, and this suggests that we are going to continue to see downward pressure until something breaks. If we can break down below the ¥85 level, it is very possible that we could drop down significantly. Breaking above these four candlesticks would be very bullish, but we would need to see something massive happen to make that move anytime soon.

