[ad_1]
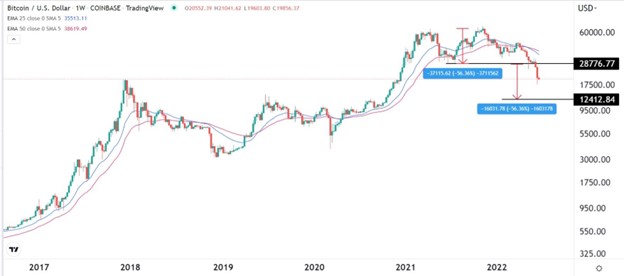
A closer look shows that Bitcoin price formed a double-top pattern as it started this downwfall. In price action analysis, this pattern is usually a bearish sign.
Bearish view
- Sell the BTC/USD pair and set a take-profit at 12,500.
- Add a stop-loss at 22,500.
- Timeline: 2-5 days.
Bullish view
- Set a buy-stop at 22,000 and a take-profit at 25,000.
- Add a stop-loss at 18,000.
The BTC/USD pair remained under pressure as investors worried about demand for Bitcoin and other assets like stocks and commodities. The pair is hovering at the 20,000, which has a lot of psychological importance.
Crypto thinning demand
Bitcoin and stocks have been in a major sell-off as investors exit riskier assets following last week’s interest rate decision by the Federal Reserve.
During the weekend, Bitcoin crossed the vital support level at $20,000 while other cryptocurrencies went in a freefall.
They attempted to recover on Monday as investors bought the dip. Still, historically, some of these sharp rallies after a sell-off tends to be a dead cat bounce or a bull trap.
Bitcoin is also struggling as on-chain data point to more supply and thinning demand. The number of new accounts with brokers has dropped sharply even as more miners release the coins to the market.
At the same time, there are signs that many crypto investors are experiencing margin calls. Last week, there were rumours that MicroStrategy was approaching a margin call since the firm borrowed heavily to acquire its coins.
Other companies that have experienced challenges recently are Three Arrows Capital and Celsius. While these are the most prominent, analysts believe that many smaller companies are struggling. Most recently, members of Solend, a decentralized lending platform built on Solana voted to force the liquidation of a whale account.
There will be no major macro data this week to move the BTC/USD pair. The most likely catalyst will be a two-day testimony by Jerome Powell, the Federal Reserve chair. In these testimonies, he will likely continue to reiterate his commitment to accelerate the tightening.
BTC/USD forecast
Turning to the weekly chart, we see that the BTC/USD pair has been in a strong downward trend. It is in the third straight month in the red. Notably, the pair has moved below the key support at 20,000 and the 25-week and 50-week moving averages.
A closer look shows that Bitcoin price formed a double-top pattern as it started this downwfall. In price action analysis, this pattern is usually a bearish sign.
Therefore, by measuring the distance between the double top and its chin, there is a high probability that the pair will drop to the key support at $12,400. This means that Bitcoin is not close to bottoming.

[ad_2]
